
Your Market Update:
- Global market returns largely positive in 2017 through May
- Both stocks and bonds positive for the week
- A few stocks disproportionately impacting S&P 500 performance
- High Yield bonds continue to outperform the broad domestic bond market
Through the end of May, the major equity categories we invest in have performed as follows:
S&P 500 Total Return: 8.66%
Developed International (EAFE Index): 6.70%
Russell Midcap Total Return: 6.92%
Emerging Markets: 12.35%
Russell 2000 Total Return: 1.48%
In fixed income, the broad domestic bond market as measured by the Barclay’s Aggregate Index is up 2.38%; Barclay’s High Yield Total Return Index is up 4.79%.
In client meetings, we tend to benchmark portfolio performance against the S&P 500 Total Return Index for stocks and the Barclay’s Aggregate Index on the fixed income side. In evaluating performance keep in mind that so far this year a handful of stocks have propelled the S&P 500 higher- specifically Apple, Facebook, Amazon, Microsoft, and Alphabet (aka Google). Bespoke Investment Management pointed out in Barron’s last week that this handful of stocks had contributed nearly 60% of the return the S&P 500 has garnered so far this year. Ned Davis Research (NDR) published a similar piece which also included NetFlix in their analysis. NDR pointed out that these six stocks while constituting 1.2% of the S&P 500 account for 13.4% of the index weighting thus having an outsized impact on performance. If our portfolios don’t contain these stocks, then all other things equal, they should be underperforming on the equity side. This situation is like what occurred in 2015 with the “FANG” stocks – Facebook, Amazon, NetFlix, and Google.
Secondly, keep in mind that only one (Emerging Markets) of the other four equity indices has outperformed the S&P 500 this year so allocations to those equity markets pull down overall equity performance.
Our fixed income portfolios have an average duration which is less than that of the Barclay’s Aggregate Index (about 5.5 years for the Index; about 3.3 years for our portfolios). Thus, when bonds rally which they have through May we realize returns less than that of the broad market all other factors equal. The opposite is true if bonds sell off and rates rise. The current bond environment has largely worked to our disadvantage from a performance perspective.
On the positive side exposure to High Yield bonds in bond portfolios has worked to our advantage as High Yield bonds have performed much better than the broad domestic bond market.
The above commentary doesn’t imply we are advocating any changes to the stocks we own (or don’t) or the composition of our fixed income portfolios. We are simply pointing out major factors driving portfolio performance currently.
Earnings this week are light once again:
Thursday – J.M. Smucker and Verizon
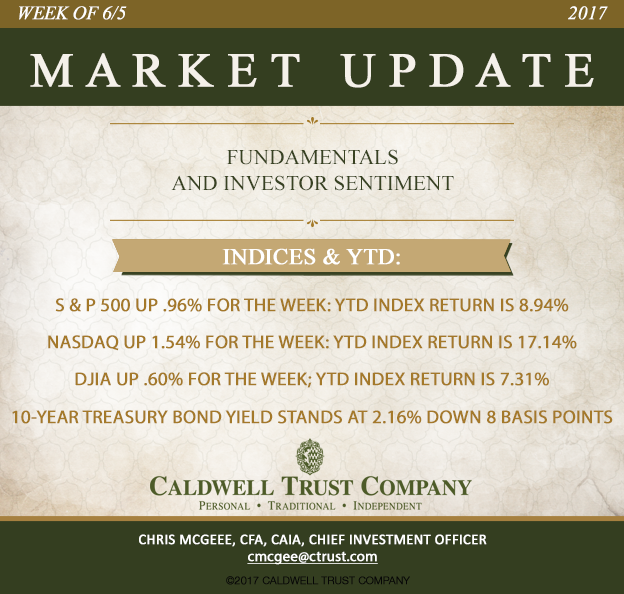
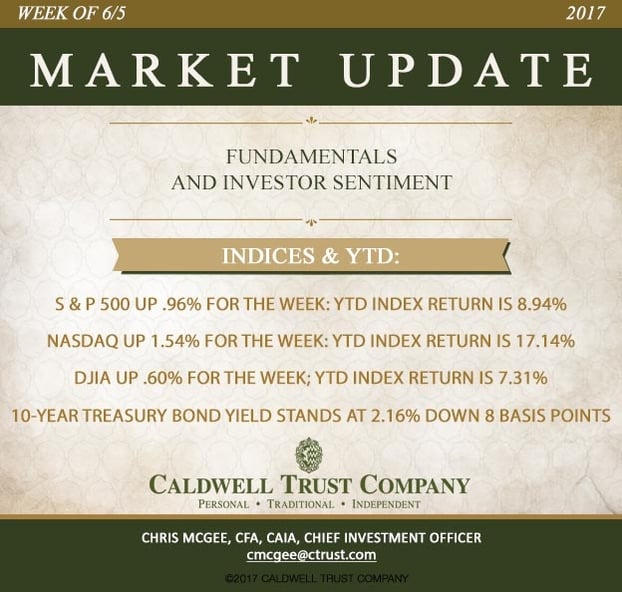
Indices for the week and YTD are as follows:
S & P 500 up .96% for the week; YTD index return is 8.94%
NASDAQ Composite up 1.54% for the week; YTD index return is 17.14%
Dow Jones Industrial Average up .60% for the week; YTD index return is 7.31%
Benchmark 10-year Treasury bond yield stands at 2.16% down 8 basis points for the week.