

- Global market returns through May mainly muted
- NASDAQ market leadership continues domestically
- 8 of 11 S&P sectors negative for the year
- 10-year Treasury yield bias i supward
Major global market indices through the end of May have year-to-date returns clustering around zero with the exception of the NASDAQ which has posted gains of nearly 8% year to date. Of note domestically, both mid cap stocks and small cap stocks are outperforming larger cap stocks. The S&P MidCap 400 Total Return index is up 3.05%, and the Russell 2000 is up 6.90% through the end of May versus the S&P 500 which is up 2.02%. The relative outperformance of small cap stocks can be attributed in large part to their relative lack of international exposure at a time when trade wars and tariffs dominate news flow.
Technology, Consumer Discretionary, and Energy stocks continue to turn in the best performance among S&P sectors. In fact, they are the only sectors turning in positive performance thus far this year (10.6%, 7.06%, and 4.68% respectively) – the other 8 sectors are all negative. The strong returns of Technology issues explain the continued performance leadership by the NASDAQ domestically. Energy shares have been positive for most of the year coinciding with the rally in crude oil prices, but the sector has sold off lately as oil prices have reversed. Performance of the Energy sector has been the most volatile of all the S&P sectors over the last 3 years as the sector rationalizes global supply and demand imbalances.
Of the remaining 8 S&P sectors showing negative performance most sectors are down slightly (less than -5%) with the exception of Consumer Staples and Telecommunication shares which are down around 13% each. As mentioned previously we believe that the more defensive sectors such as Staples, Telecommunications, and Utilities will continue to lag the broader market. On a related note, Growth stocks continue to outperform Value oriented stocks not only in the S&P 500 but across capitalization styles. Further, the outperformance of Growth stocks relative to Value stocks continues to be sizeable. We believe the relative outperformance by growth stocks will continue.
The yield on the benchmark 10-year Treasury bond closed May at 2.82%. While the yield has risen 42 basis points since the year commenced, of late the yield has declined from above 3% due to geopolitical tensions, concerns about the European Union (specifically Italy), and on again – off again talk of tariffs and trade wars. We expect these factors to continue into the second half of the year. We believe that ultimately the bias is to the upside (rising yield) based on expectations of a pick up in economic growth and inflation domestically. We still believe that domestic rates will remain subdued enough to prevent a rotation out of equities and into fixed income investments. An increase in short term rates is anticipated by the markets in June with some debate around whether one or two more increases will occur prior to year-end.
Performance continues to be lackluster for domestic fixed income as the broad domestic bond market declined 1.5% through May. High yield bonds declined .24%. Three-Month Treasury bills returned .69%. Given the current economic environment and capital market expectations we believe the fixed income space will continue to experience challenges. That said, fixed income remains an integral part of portfolio construction as the asset class mutes overall portfolio volatility.
As we approach the balance of the year expect underlying market fundamentals to remain solid. News flow and headlines should continue to dominate trading action. It is doubtful that the low volatility consistent ascent of the domestic equity markets we experienced in 2017 will resume for the foreseeable future.
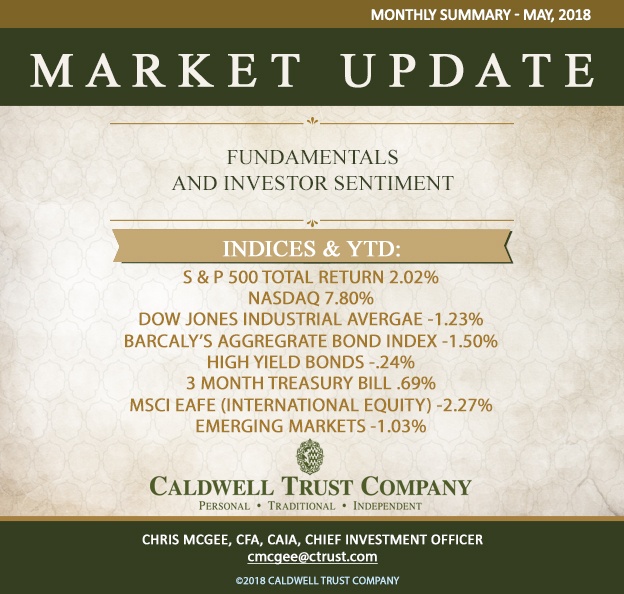
Major market returns year-to-date thru May were as follows:
S&P 500 Total Return 2.02%
NASDAQ 7.80%
Dow Jones Industrial Average -1.23%
Barclay’s Aggregate Bond Index -1.50%
High Yield Bonds -.24%
3 Month Treasury Bill .69%
MSCI EAFE (International Equity) -2.27%
Emerging Markets -1.03%