

 Many a market pundit has recently offered an opinion on stock valuations and most have ruled that the U.S. market is approaching an overvalued state versus its own history. We would generally agree. Yet in our experience, valuations in and of themselves are not enough to affect significant asset allocation changes. In this investment letter we will prove the idea that markets can remain overvalued or undervalued for long periods of time and don’t significantly assist in the timing of allocation changes. In Caldwell’s investment department we like to stick with the data, which never lie. So it’s fitting for us to begin our discussion with a chart courtesy of Ned Davis Research.
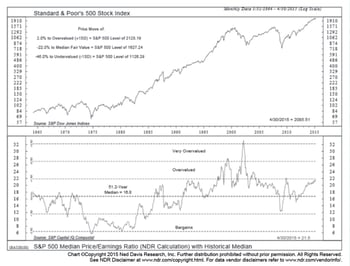 This chart depicts the median price-to-earnings ratio of the S&P 500. The median has been chosen instead of the average so that any large positive or negative value will not influence the ratio as it would affect the average. The median is simply the middle observation when put in order. As you can see, the median price- to-earnings ratio on stocks since 1964 is 16.8. It is clear that the market is very rarely at the median price-to-earnings ratio.
One could look at many valuation metrics that are valid but price- to-earnings ratios are probably the most well-known and are followed by the investing public so we will stick with that metric.
Based on the chart, let’s say that any price-to-earnings ratio above 22 is overvalued and any price-to-earnings ratio below 12 is undervalued. Let’s also say that anything between 12 and 22 is fairly priced. Now let’s break up the chart into manageable sections. This can help to determine whether stock market valuations can offer anything to investors that indicate adjustments in allocation.
Let’s examine the period from 1964 to 1982. As one can see, the valuations of U.S. stocks were below the median price-to-earnings ratio and remained there for a significant length of time. In fact, from 1973 to 1982 the ratio remained below 12. That’s nine years! It’s a long time to wait for markets to rally off the back of low valuations. As one can also see, the returns for stocks in that period were minimal, point-to-point.
The next period, from 1982 to 2000, features price-to- earnings ratios climbing steadily from an undervalued basis through a fairly valued situation and then into overvalued territory. Valuations first entered the overvalued zone (above 22) in 1998. An investor who sold then would have missed the 28.5 percent return in 1998 and the 21 percent return in 1999. It would not be fun to leave those returns on the table.
The last section features the most recent period, from 2000 to today. During this period valuations made a steady march lower and in 2007—the year before the Great Recession began—settled comfortably in the fairly valued zone at 20. That’s no real cause for alarm from a valuation perspective, yet our readers may recall what was in store for us beginning in the later part of 2007 and ending in March of 2009. Valuations ahead of the worst bear market since the 1970s provided no warning signal. None.
Conclusion
In our view, valuations do not provide much help in terms of guiding allocations. We agree with most of the talking heads that stocks are getting overvalued, yet we are reminded that they can remain overvalued or undervalued for long periods of time. We are still of the mind that stocks can provide better long-term return potential despite the rising risk of a correction, and we continue to buy stocks on weakness.